What Numbers Can’t Show: The Story Behind the Zones Written by: Rosalea Matta | Design Intern @ DIR-India

Every month, numbers are tallied. Children weighed. Red, yellow, green zones. Weight gained. Weight lost. Zeros that sting, and upward arrows that bring hope. These figures make their way into reports and tables. 

But behind every number every gram gained or lost is a story. 

One that slips past graphs and summaries, waiting to be noticed under the shade of a tree or in the quiet sigh of a mother at her doorstep. 

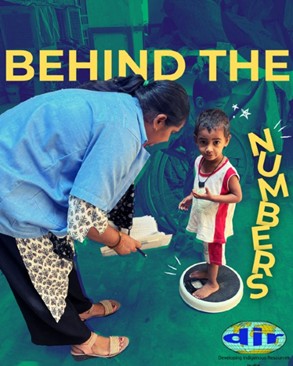
This is a story about what the numbers don’t show. 


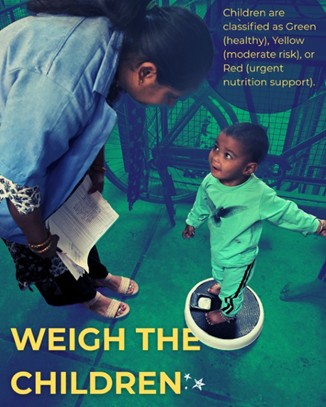
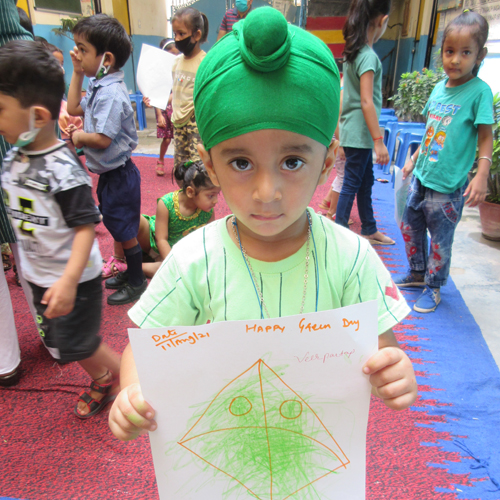
At first glance, the zone report reads like a performance chart. Children in the red zone are at risk of undernourishment and fragile health. Yellow signals caution. 

Green marks recovery, as per WHO standards. 

But dig a little deeper. 

Some Health Promoters (HPs) report a high number of children weighed, often with many in the red. Others have fewer entries, with gaps or zeros. It’s tempting to assume diligence or neglect. But the truth is more layered. 

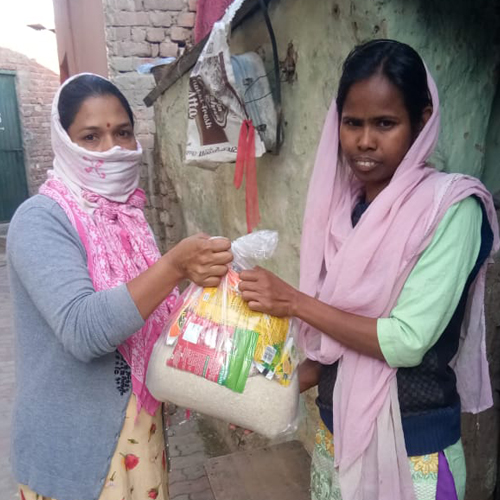
One HP may serve a densely populated block, while another works in a community constantly in flux where migration, seasonal work, or housing insecurity disrupt continuity. The data doesn’t show who waited outside a locked gate or who walked an extra kilometre just to find a child. 


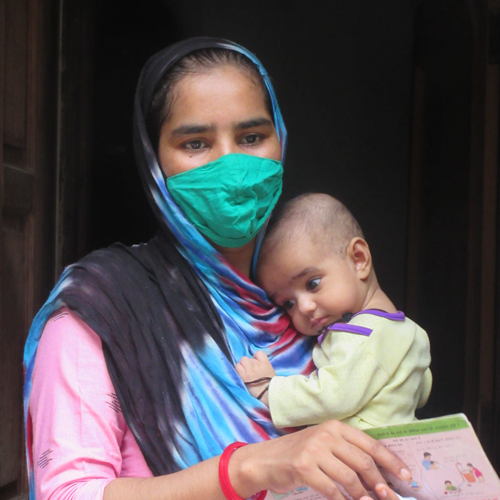
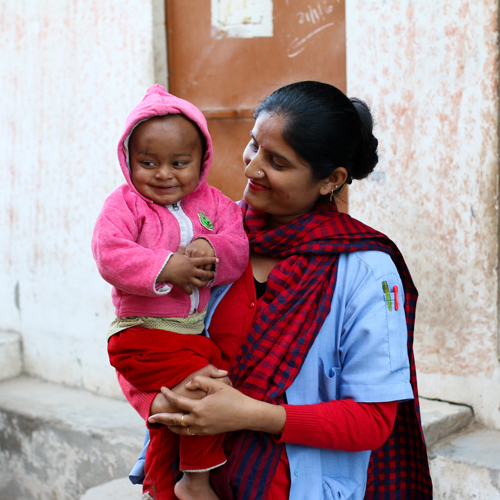
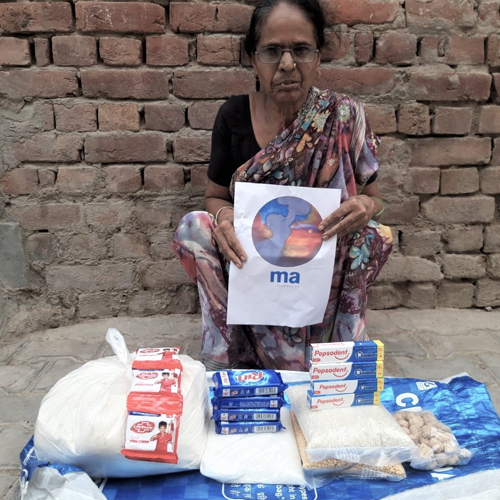
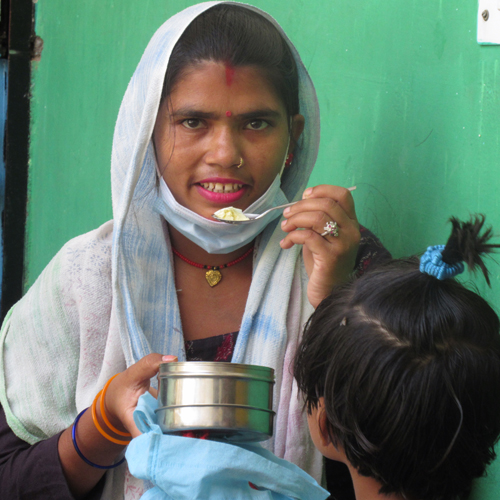
During my field visits, I witnessed something no chart could reflect: trust. Mothers bringing their children voluntarily. Conversations that weren’t forced but flowed about fever and feeding 

One mother told us: 

“Wazan karwana zaroori hai… warna toh pata hi nahi chalta.” 

(Getting them weighed is important… otherwise how would we know?) This trust isn’t built overnight. It’s earned over months through consistency, 

warmth, and deep listening. That moment when a child steps onto the weighing scale isn’t just a medical check; it’s an act of faith. 

Each month, children shift across zones—sometimes moving from red to yellow to green, and sometimes, heartbreakingly, slipping back.

A single sick week can erase two weeks of progress. One lost job can mean fewer meals at home.

I remember reviewing a red zone chart and pausing at a child’s name. “What’s her story?” I whispered.

Was she teething? Recovering from infection? Was her mother unwell too? Or was it just a week when lentils ran out?

Here’s what the data can’t always tell us:

A zero might mean absence or simply a locked door.

A gain might reflect improved nutrition or the kindness of a neighbor who shared milk.

A drop might mean illness but also a mother too tired to ask for help.

We must not discredit the data—it is vital. But it must walk hand in hand with stories, not ahead of them.

the depth of lived experience, we move from monitoring children to 

understanding them. From tracking outcomes to building trust. 


One of my most memorable visits didn’t involve a weighing scale. It was a circle of four women under a building shade, talking about the heat, clean water, and simple, sustainable food practices. That’s where real change begins—not in clinics, but kitchens. Not on charts, but in shared stories. 

As we continue our work in Janta Colony and Dhanas, let’s not just count children 


Let’s see them. 

Let’s listen. 

And let’s design interventions that honour not just their stats, but their stories. 

Other Donation